
The FHS: Gauging the Happiness of Every MLB Fanbase
- Mar 18, 2017
- 10 min read
Ah, to love a terrible baseball team. It's excruciating, is it not?

As a hardcore baseball fan born and raised in Seattle, I slowly grew immune to the regular failure of the hometown Mariners. I digested the constant stream of optimism that was fed to me by Times and PI writers in March, tried to find solace in a sub-.500 record in July, and always became excited for the September roster expansions, convincing myself of promising young talent and repeatedly adopting the phrase "Just you wait: in two years, we'll be good." But two years came, and two years went – and this happened again, and again…and again. It's still happening.
At one point, after I drifted off to college in Milwaukee, a friend of mine informed me that the team I had grown up watching was simply "traditionally shitty." Upset at being labeled as such, I began searching for opiates to comfort my woes as a Mariner supporter. Often I would look to North Chicago and the 108-year title drought in Wrigleyville, finding regular solace in saying "Well, at least I'm not a Cubs fan." On other occasions I might lean on Cleveland for support, recognizing that I knew more about Charlie Sheen's Indians than whatever the Tribe's current 25 consisted of. Yet after this past World Series, these antidotes are looking less and less comforting…and my reality as a Seattle baseball fan turning more and more into this humbling reality:
When you consider yourself a die-hard fan of the Seattle Mariners, you die a lot.
Now, we Seattleites understand the truth of this statement – but there are plenty other fanbases out there that have experienced a similar historic woe. The Pittsburgh Pirates, for example, recently ended an abysmal stretch of 18 consecutive losing seasons, the longest such streak in the history of baseball. The San Diego Padres, meanwhile, have never won a World Series and have made the playoffs in only 5 of their 48 seasons as a ballclub. The Milwaukee Brewers are also just really, really bad. To be honest, quality arguments could be made for a good 7-10 MLB teams as to why they are "the most desperate" for a World Series ring (if not just an October appearance) – which got me hooked on investigating the actuality of each. But since subjective observations and opinionated reasoning are becoming constantly disputed in America, a call for quantifiable measurement is in order. We love to measure shit with numbers; we want facts and figures in our debates and proofs.
Enter: The MLB Fan Happiness Scale (FHS) – an index that, through statistical observations of the history of all 30 Major League ballclubs, gauges the current level of contentment (and woe) of each fanbase in baseball by ranking them in comparison to the other 29.
How the FHS Works:
It's no secret that happiness as a sports fan comes from watching your team succeed: when your squad does something well, you have a reason to cheer. In baseball, success is most plainly measured by simply winning baseball games (more than losing them). The next step of success comes in a team's ability to wrangle up enough wins to make it to the playoffs – and finally, of course, come pennants and titles.
In concordance with these observations, the FHS measures fan happiness based on how often they get to watch their teams do all of these things: how often fans get to watch their team win a game, how often fans get to watch their team make it to the playoffs, how often fans get to watch their side win their respective league, and then how often fans get to watch their team celebrate a World Championship.
Pause. Before proceeding further, it must first be understood that fanbases are not to be mistaken with franchises. It is understandable to assume that the relative success of every franchise would automatically relate to the relative happiness of its fanbase – but in reality, the two are quite different. The term franchise encompasses every year in existence since the specific organization was created. This obviously includes current location, yes, but a franchise also might have played ball in a completely different city before relocating to where they are right now. And when this happens…supporters from the franchise's old location for the most part dissolve. (A Seattle franchise example: I used to root for the Sonics. I now despise the Thunder). A fanbase, on the other hand, refers to the supporters of the team since their most recent relocation: the fans who have cheered on their home-team since they began playing in their home-town. Name changes are one thing (the Boston Americans are the same team as the Boston Red Sox, just as the Devil Rays are still the Rays), but total relocation creates a different fanbase altogether. Therefore, when assessing happiness, the Washington Nationals' statistics do not include the franchise's abysmal performance during its stint in Montreal – while meanwhile, the Milwaukee Brewers' statistics do not include the success of Hank Aaron and the Milwaukee Braves (a franchise now in Atlanta). The numbers for the Dodgers begin when they moved from Booklyn to Los Angeles – but the Brooklyn numbers do not correlate to the Mets' history…you get the point. For clarity, the foundational year (most recent relocation) of each fanbase is indicated next to the team in every FHS chart that's coming up.
Resume. Since baseball is old (really old) and some teams are older (far older) than others, some teams therefore have had more of an opportunity to succeed (or fail) than others. Example: the Cleveland Indians and San Francisco Giants have each won 6 pennants in their history – but does that mean that they are equal in this measurement? No, because the Giants have existed for 59 years, while the Indians have been around for 116 – nearly twice as long. Thus, San Francisco has been more successful in winning pennants than Cleveland because SF achieved the same total in half the time it took the Tribe. Consequently, Giant fans rank happier than Indian fans in this category.
Because of instances like this (of which there are many), analysis based purely on totals cannot be conducted, for it is unfair to the fanbases who have existed for a shorter (or longer) time than others. Therefore, the Fan Happiness Scale levels the playing field by weighing historic averages as opposed to historic totals. These averages come in a team's overall winning percentage as a ballclub, their playoff appearance rate, pennant rate, and title rate. Once each average has been calculated, the FHS then ranks each team based on where they stand against the other 29 Major League ballclubs. If team X has the worst rate in the MLB, they are given a ranking of 1 – and if they have the best rate, they get a 30. Finally, the FHS adds up all of the rankings: the higher the number, the higher the team's success rate – and therefore, the happier the fans.
Breathe. You'll get it soon.
The Calculations:
Let's start with the basics. Here is a table that takes into account every baseball game each current team has ever played (excluding Spring Training), and shows their historic winning percentage.*

While the predominantly 21st-century baseball fan in me is somewhat surprised by the bookends of this chart, my peak intrigue lies in the middle of the table – especially the two ranked #18 and #17 in FHS, respectively. Look at the two Chicago teams: both brought in the modern era, both have played over 18,000 games (eighteen thousand baseball games!), and yet over 116 years, the Cubs have won only 9 more games than the White Sox. Nine! BUT they have also lost 23 more games than their cross-town rivals (having played in more playoff games), which means their overall winning percentage is .0005 lower than the White Sox. Fascinating.
What's important for our analysis, however, is that you keep an eye on the bottom of the table. Philadelphia's historic win percentage is bad, yes – but they have found ways to make up for it. They get the lowest FHS rating in this category, but things look up from here. Be sure to watch the handful of teams just above them. Let's continue.
Up next comes a glimpse at how often each team reaches beyond its historic winning percentage and accumulates enough victories in a season to earn them a birth in October baseball. This measurement is the Playoff Appearance Rate (PAR), which his calculated by dividing Years Active/Playoffs Made to show the average number of years that each fanbase waits between watching their team in the postseason.

Holy shit, White Sox fans. Damn, I'm sorry. As supporters of a 116-year-old ballclub that has only made the playoffs 9 times, you wait an average 12.89 years between getting to experience October baseball in Southside Chicago. We have traditionally turned North in the Windy City to shed sympathy – but perhaps we have been slightly blinded, and must pay some more attention your direction.
Yes, the White Sox get the 1 in FHS in this category, but as was the case for Philadelphia and winning percentage – it's all up from here. And as was also the case with Philadelphia and winning percentage, take a look again at the handful of teams circling the drain right above Chicago. Recognize a few? If not yet, you will. Let's continue.
Once teams make it to the playoffs, do they flop immediately, or do they go on to be crowned as champions of their league and get to play in the Fall Classic? The next FHS category of measurement takes this all into account, and analyzes the Pennant Success Rate of each team (calculated by Playoffs Made/Pennants won).

Reaction one: my eyes are immediately drawn to the zeroes at the bottom. What this means is that these two teams – the Washington Nationals and our dear Seattle Mariners – have never clinched a pennant in their history, meaning that their fans are still waiting for their first World Series appearance (let alone title). Yeah, Washington is young (and have been fairly successful since the franchise moved from Montreal), but for the purpose of this study, both the 'Nats and the 'Ners get 1's in this FHS category.
Reaction two: check out the solid 100% that the Marlins hold. Okay, yeah, they have only made the playoffs twice (their PAR is terrible), but they have won the National League both of those times. And wait for the next category – for Fish Fans, it only gets better.
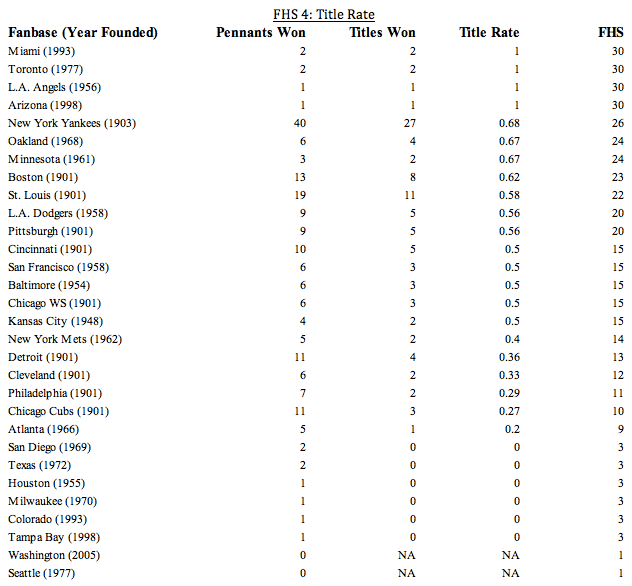
Not only do the Marlins make the Series every time they (infrequently) make the playoffs, but they win the Series every time they make the playoffs! In their young, 24-year-history (I'm 24 years old), the Fish have played in October twice, and both times come home with the Commissioner's Trophy. The numbers may suggest that they won't make the postseason again until 2029…but don't worry Marlins fans, you'll be the Champs then.
The N/As for Washington and Seattle are obviously elephants in the room as well. But the explanation is quite simple: the Nationals and Mariners have N/As because it is impossible to calculate a title rate for either, for you can't divide by zero appearances (Title Rate = Titles Won/Pennants Won). When you have never even played in a World Series, how could you win one? The six zeroes above them, meanwhile, represent the remaining MLB fanbases that have never celebrated their team winning it all.
Concluding Calculations:
The final FHS chart provides the overall happiness rating for each fanbase, as it adds up each team's rankings from the four charts above – giving the cumulative, quantitative measurement in historical winning percentage (Win%), Playoff Appearance Rate (PAR), Pennant Rate (PR), and Title Rate (TR). With four categories that each have 30 possible FHS (one ranking spot for each MLB team), the highest rating is therefore a 120 (4x30), and the lowest a 4 (4x1). Let's take a look at the totals.

1) Damn it'd be fun to be a Yankee fan. Yeah, we know that and all – but my god! On average, you guys see more wins than all other teams but one, you make the playoffs every 2.19 years – and when you do, there is a 77% chance you take home the AL Pennant and from there a 68% chance you'll win the World Series. 27 titles and 40 pennants. With a 114 on the Fan Happiness Scale, Bronx Bombers fans are at 95% possible happiness (114/120). Numbers don't lie.
2) Ah, the Mariners.
Denouement:
Let's take a brief trip around the bases with Seattle. Now celebrating their 40th anniversary, the Mariners have posted an overall winning percentage that comes in just a few one-hundredths of a percent better than last place. And yet when they do end a season over .500, it appears that it is rarely that far over, for they average a decade between playoff appearances. (On this note, an interesting 2016 FiveThirtyEight article hypothesized that the Mariners might be the most unlucky MLB team out there). And on the off-chance that the 'Ners do play in October, we fans shouldn't expect much from there – for Seattle is still waiting to clinch its first ever AL Pennant. (Even in 2001, when the M's tied the record for wins in a season, they fell short of advancing to the WS). Finally, just to throw some salt in the wound, the 'Ners currently hold the longest postseason drought in baseball, now at 15 years and (quickly) counting.
Bad, bad, bad. Sad, sad, sad.
But there's hope! Just because the Seattle fanbase has had the least to root for in all of baseball doesn't mean that the fans aren't there. Since the team's postseason slide, only once has Safeco Field finished in the bottom 5 of the annual attendance report (2012 was a rough year, man) – and often, despite severely sub-.500 records, the Mariners find a way to draw good crowds. (This past year, in 2016, Seattle finished above the AL Champion Cleveland Indians in attendance. Hm). From my personal experience in Seattle, I've also come to grasp that in the city there exists an almost underground appreciation for the harmless Mariners – one that accepts the historic woe, but also finds a charm in it.
But in baseball, being harmless often relates to being loved, once you find that long-overdue bit of success. This past year's Fall Classic was the epitome of it: between the "traditionally shitty" Indians and Cubs, America couldn't get enough of it: the ratings outstripped those of the NFL at times, and Game 7 raked in the most viewers in a quarter-century. If the 2016 World Series was a sign that America is really all that crazed about romantic baseball stories (I know I am – I teared up at the Cub fan/father's grave story just as I do every damn time Kevin Costner and his dad play catch at the end of my annual Field of Dreams screening), then perhaps the world will turn to the Mariners for its next emotional run, the next time the team catches a bit of success. And as a die-hard Mariner supporter (who dies a lot), I dearly hope that that success comes in 2017 – for our fanbase deserves it. If October baseball returns to Seattle, the great Northwest will explode with passion: 2001 was amazing, but it was also a long time ago. The statistics above show that we have historically had the least to cheer for out of all 30 teams...and we're ready to cheer for something again.
* All data used was collected from the "Team Encylopedia" pages of Baseball Reference. Statistics only include modern era.


Comments